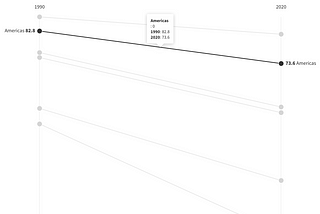
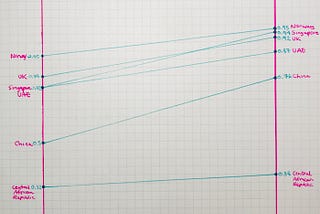
Kristi YangDataviz Final<div class=”flourish-embed flourish-scatter” data-src=”visualisation/4707474"><script…2 min read·Dec 27, 2023----
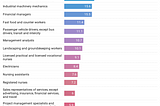
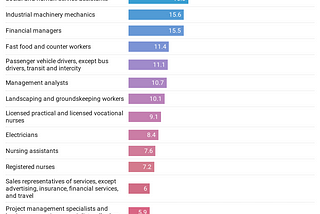
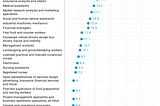
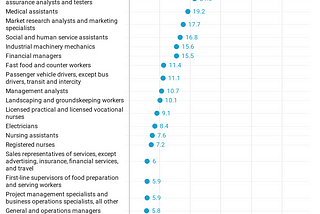
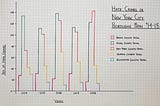
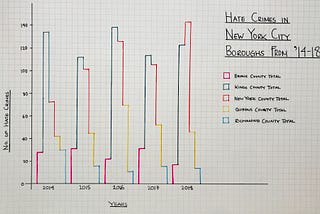
Kristi YangThe Shape of the Final ProjectFrom all the iterations I made of this dataset, I think the the most effective was the bar graph (rightmost graph). This graph included…3 min read·Nov 18, 2020----
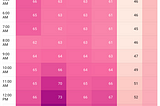
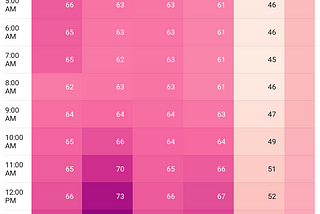
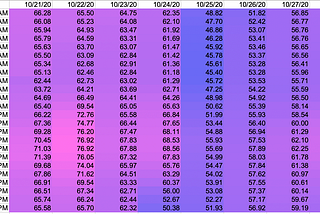
Kristi YangConditional Formatting & DatawrapperI think the color works really well when dealing with temperature, I was able to reflect colder temperature with colder colors. From the…2 min read·Oct 28, 2020----
Kristi YangDataviz MidtermIn light of recent events, with the future of women’s reproductive health in the United States up in the air, I decided to tackle the…4 min read·Oct 21, 2020----
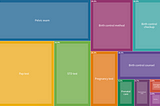
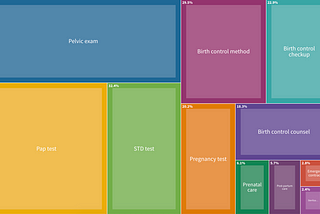
Kristi YangAll The Chart TypesFor my chart this week, I looked at family planning and related medical services, using the CDC 2015–2017 data on Family planning and…2 min read·Oct 7, 2020----
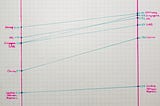
Kristi YangAsking questions of dataFor my midterm, I am choosing to focus on family planning and women’s health. Though a topic often discussed, I find it extremely…1 min read·Sep 30, 2020----
Kristi YangWrangling DataFrom reading Sandhya Kambhampati’s piece “Cleaner, Smarter Spreadsheets Start with Structure” I was surprised to have been surprised by…2 min read·Sep 16, 2020----